 In 2004 UCLA physicist Didier Sornette published a book with curious and ambitious title: Why Stock Markets Crash. In the book he presents evidence of a specific price pattern that occurs before market crash, and specific mathematical formula to describe it.
 The formula combines log-periodic oscillations, and power-law "trend" (LPPL) - both terms will be explained below. It looks formidable on the first look, but is actually quite simple to break down into two intuitive parts.

Here's how it works: the first two terms A + B ... describe the level and trend of the price, specifically price growing at unsustainable rate ( log of price vs power of t ).
The third term C ... cos describes the oscillatory behavior of price right before crashing, and is a little more involved. We all remember regular oscillations like those created by sin or cos functions.

However these "regular waves" are not how markets behave. In order to better describe the price pattern the formula augments oscillations in such way that they increase in frequency up to the point of market crash as below ...

... and also decrease in amplitude.

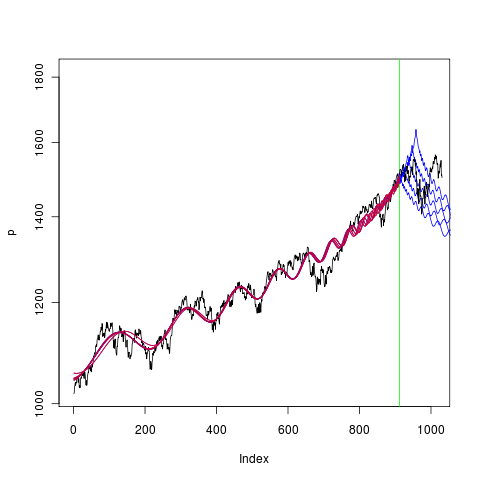
Combining together trend and oscillations, the formula describes market as shown in the chart below.
Next week I will introduce Taylor Trott - author of LPPL Market Watch blog, and The Bubble Index - website specifically dedicated to tracking market bubbles in equities, currencies, and commodities worldwide.


No comments:
Post a Comment